
Measuring health inequalities
Health inequalities are described and measured by comparing the health outcomes of different groups. Health outcomes such as life expectancy, healthy life expectancy and rate of disease are compared using groupings such as
- gender
- ethnicity
- social class
- area deprivation
- employment status
- educational attainment.
Measuring health inequalities
The simplest measure of health inequalities is to compare the health of those in the lowest socio-economic group with those in the highest group. This indicates the gap in health outcomes. For example, men in the least deprived areas of Scotland live nearly 24 more years in ‘good health’ than those in the most deprived areas.
This comparison can either be in
- absolute terms - e.g. there are 100 more deaths per 100,000 population per year
- relative terms - e.g. there are twice as many deaths per 100,000 population per year.
However, simple comparisons of the lowest and highest groups do not account for the social gradient in health across the whole population. The evidence shows that, in general, the lower a person’s position is in society, the worse their health will be. Inequalities can be seen across the whole social spectrum such that all groups except the best off are disadvantaged. More complex statistical measures are applied to monitor these differences.
Local comparisons
Health inequalities within local areas are illustrated in the images below. The first shows male expectancy going down by two years for every station on the train line in Glasgow travelling from Jordanhill (in the more affluent west end) to Bridgeton (in the less affluent east end). On average, a man born in Bridgeton can expect to live 14.3 years less than his counterpart in Jordanhill, and a woman 11.7 years less.
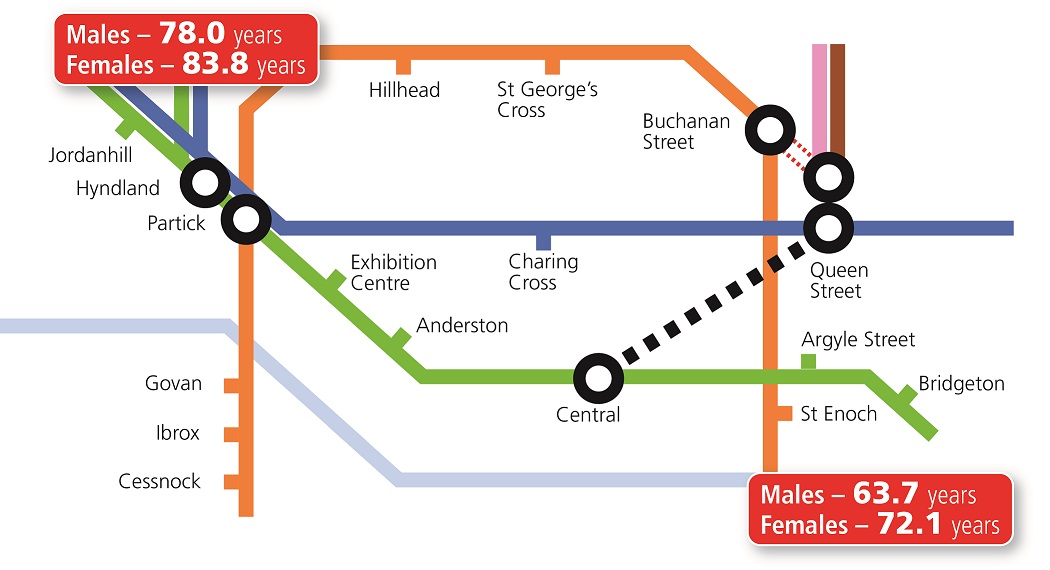
These data have been updated using the ScotPHO profiles published in June 2015 comparing the life expectancies in Broomhill (close to Jordanhill station) and Parkhead and Barrowfield (close to Bridgeton station) intermediate zones.
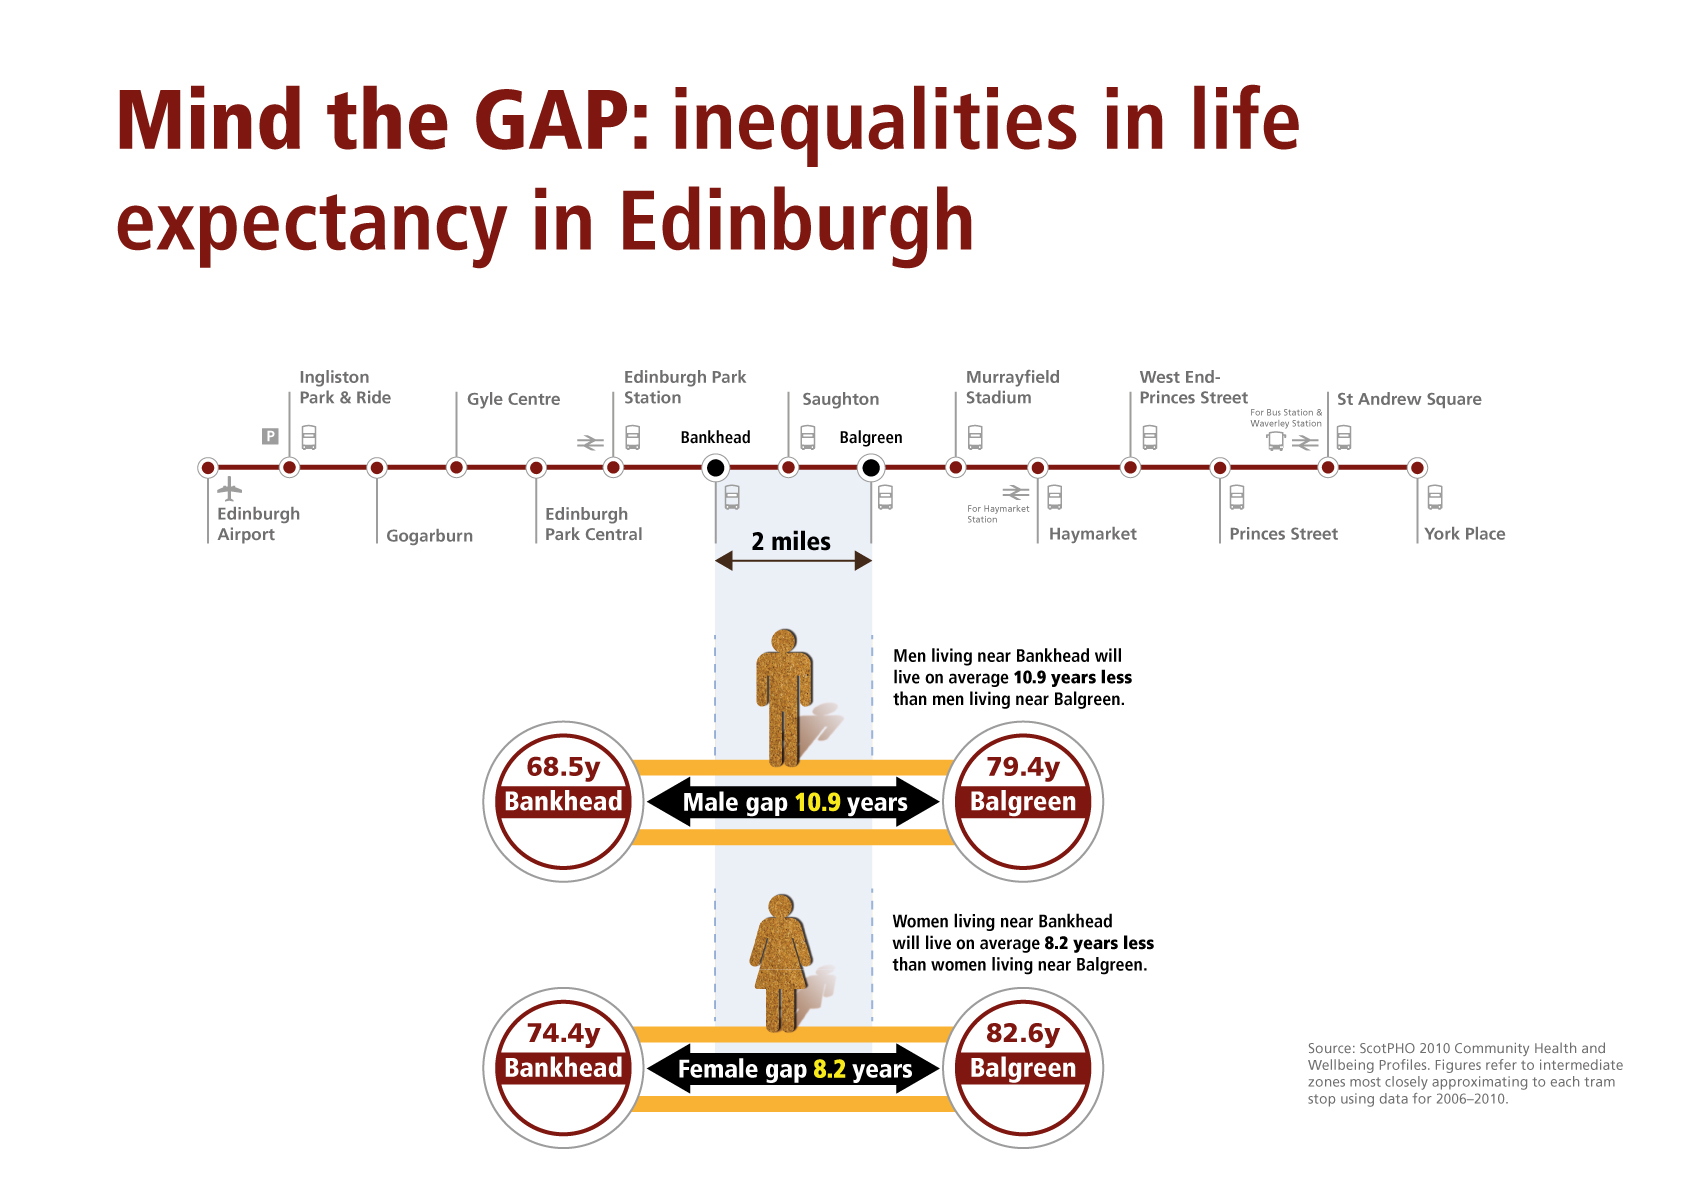
The second image highlights continuing health inequalities across Edinburgh. Despite being only two miles apart, the gap in average life expectancy at birth between those living in the residential neighbourhoods near to the Bankhead tramline stop compared to those living near the Balgreen tramline stop is almost 11 years for men and 8 years for women.
Local comparisons of health in communities and of health inequalities are also available from the ScotPHO website including geographical comparisons, time trends and rank charts. The deprivation profiles show health inequalities as measured by the deprivation of the relevant area. There are a wide range of measures including
- child poverty
- life expectancy
- teenage pregnancy
- out-of-work benefits
- all-cause mortality amongst 15-44 year olds
- young people not in education, employment or training.
International comparisons
International comparisons of health inequalities (external site) on the Scottish Government website are based on comparing the health of population groups who have achieved different levels of educational attainment. On this measure, health inequalities in Scotland are worse than all other countries in western and central Europe.
Long term trends
There has been a substantial decline in absolute mortality inequalities since around 2003, with health improving across all deprivation groups.
However, relative inequalities in mortality have increased steadily since 1981. This is because the health of the least deprived groups has improved at a faster rate than the most deprived.
For mental wellbeing and healthy life expectancy, relative and absolute inequalities have increased since data became available from 2007/8.
The Scottish Government publishes a Headline Indicators report on the latest trends in health inequalities every year. This includes inequalities in
- wellbeing
- low birth weight
- premature mortality
- deaths from cardiovascular disease.
Trends in health inequalities in Scotland for a longer time period (1981-2001) are available in a report from the Social and Public Health Sciences Unit (external site).
Data currently available for inequalities in health between equality groups (e.g. ethnicity or gender) is summarised on the ScotPHO site (external site).